
For more than a decade, this report has published what physicians say they want from healthcare marketers. This year we tested every answer against what they actually do.

THE PREMISE
Say Versus Do
Surveys tell you what physicians believe about their own behavior. They are honest, but memory and intention are not the same as action. This year, we set each survey answer beside a behavioral signal: HealthLink Dimensions' own email engagement data, paired with programmatic measurement from our partner DeepIntent across verified clinicians. Together they form the 'Do' layer beside the survey's 'Say.' It carries weight because it is measured behavior, first-party and partner-verified, not a claim about intent.
896
The Survey
Over 890 qualified physicians across 25 questions.
2.4M
The Open Log
Roughly 2.4 million opens, measuring time-to-open, day, and hour.
221
The Campaigns
221 campaigns, representing nearly 8.3 million emails, sent Jan-Jun 2026, each classified into a content type by reading its full HTML creative.
HOW TO READ EACH FINDING
A behavioral reading exists in our data and confirms or counters the survey.
The survey itself reveals the gap; no behavioral overlay is needed.
Gain key insights from real world survey and engagement data to better inform your marketing campaigns.
FINDING 1
Do physicians read what you send?
WHAT THEY SAY
54% review a relevant message immediately, 24% save it for later, and only 6% ignore it.
WHAT THEY DO
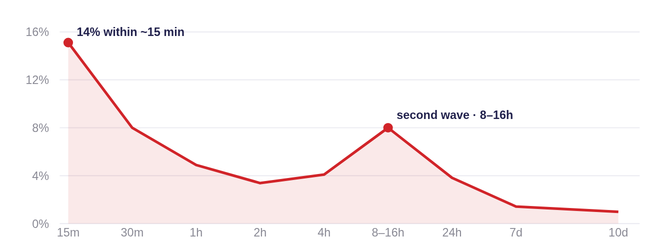
Engagement is bimodal. ~14% of opens land within the first 15 minutes, the single largest bucket, and ~39% within the first hour. A distinct second wave arrives 8–16 hours later; ~80% land within 24 hours before tailing off over days.
What physicians say they do with a relevant message

When physicians open: a fast spike, then a delayed second wave
Share of all opens by time-since-send · ~2.4M opens
THE PLAY
Design for the first open. Front-load value and time resends to days, not weeks.

FINDING 2
How often do physicians want to hear from your brand?
WHAT THEY SAY
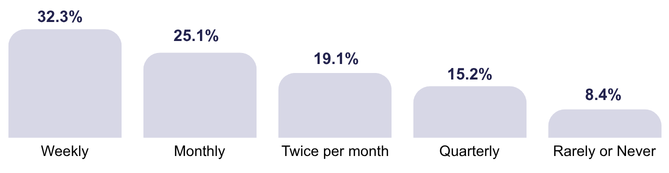
76% want information at least monthly, and 32% want it weekly.
WHAT THEY DO
DeepIntent's measurement found that 54% of physicians were reached by more than 10 brands last year. Despite this, there is no observable fatigue or impact to click engagement — which remains flat across frequencies.
Rx (prescription) impact is a better measure of media impact. Optimal frequency to Rx is varied across therapeutic areas and specialties, but Rx rates increased as frequencies increased.
Stated appetite for contact
No fatigue as frequency climbs
Click-through rate by ad frequency · no decline point · exposures per physician

54% of HCPs were reached by 10+ brands at an avg of 30 impressions per month.
Pharma campaigns represent less than 0.01% of all ad impressions delivered to HCPs.
THE PLAY
Set the frequency ceiling by writer and script date, not by clicks.

FINDING 3
When are they actually paying attention?
WHAT THEY SAY
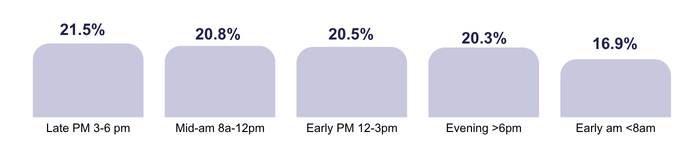
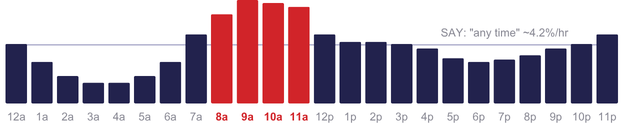
~20% say they are receptive in every daypart, a near-flat 17–22% from morning to night. Taken at face value, timing barely matters.
WHAT THEY DO
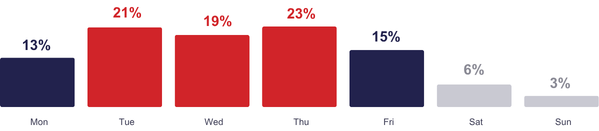
Opens are anything but flat. Tuesday–Thursday carry ~62% of the week and opens peak mid-morning, ~8–11am — a pattern shaped partly by send timing, but concentrated enough to act on.
When physicians say they are most receptive
Hour of open contradicts the flat-day claim
Share of all opens by hour (EDT, approximate) · dashed line = the flat ~4.2%/hr physicians describe
Opens cluster Tuesday-Thursday | 62% of the week's opens
THE PLAY
Concentrate sends mid-morning, Tuesday through Thursday. "Any time" is not a media plan.
FINDING 4
What content actually earns engagement?
WHAT THEY SAY
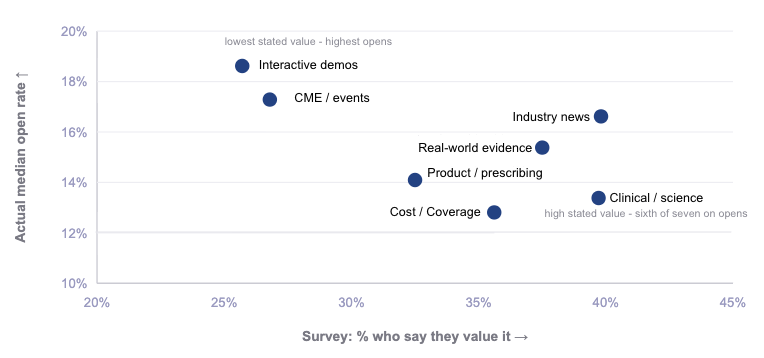
40% rank clinical trial summaries and scientific data as the single most valuable content type.
WHAT THEY DO
Preference does not predict behavior. The most-valued type (40%) sits near the bottom on opens (13.4% median). Lighter formats lead: interactive case tools (18.6%), CME (17.3%), podcasts & video (16.4%).
What physicians value does not predict what they open
Each dot is a content type · survey value (x) vs. actual median open rate (y)
THE PLAY
Invest in the lighter, practical formats that earn opens. Ease off dense clinical material.
FINDING 5
Where do they actually go for information and how do they get there?
WHAT THEY SAY
39% name association sites and medical journals first. Manufacturer sites lag.
WHAT THEY DO
According to DeepIntent data, paid search drives 47% of how HCPs reach brand sites. 63% of that traffic comes through a branded drug name query while 14% arrives through condition education searches.
However, paid search traffic is falling fast, averaging a -22.9% decline year over year. Though scale is small, AI-referred visits are up +83.7%. The analysis was conducted across 1.6M total HCP Site Visits.
Stated first stop for clinical information
% naming each as their primary destination

How HCPs reach brand sites is shifting
Year-over-year change in referral share · ~1.6M HCP site visits
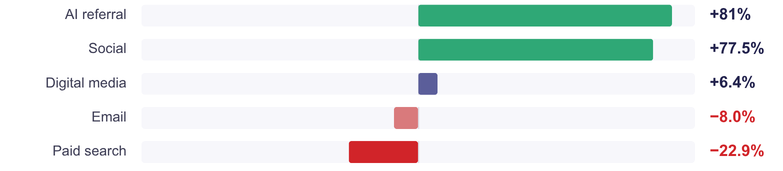
Paid search still drives ~47% of brand-site arrivals today, but it is declining while AI-referred and social visits climb.
THE PLAY
Support clinical content, not only brand-name terms, and set a baseline for AI-driven discovery now. Evaluate other channels to reach and engage HCPs beyond search.

FINDING 6
Which platforms actually reach them?
WHAT THEY SAY
51% say they use TikTok versus just 22% on Doximity, but that is personal use, not professional.
WHAT THEY DO
According to DeepIntent data, more than 97% of HCPs are reachable across Display, CTV, Audio, and Native. HCPs engage with the open web just like consumers, the same entertainment, sites, and channels.
Reflects 3.4M HCPs across channels. Walled gardens such as Facebook were not measured.
Personal reach beats professional reach
Stated platform use · full battery · n= 896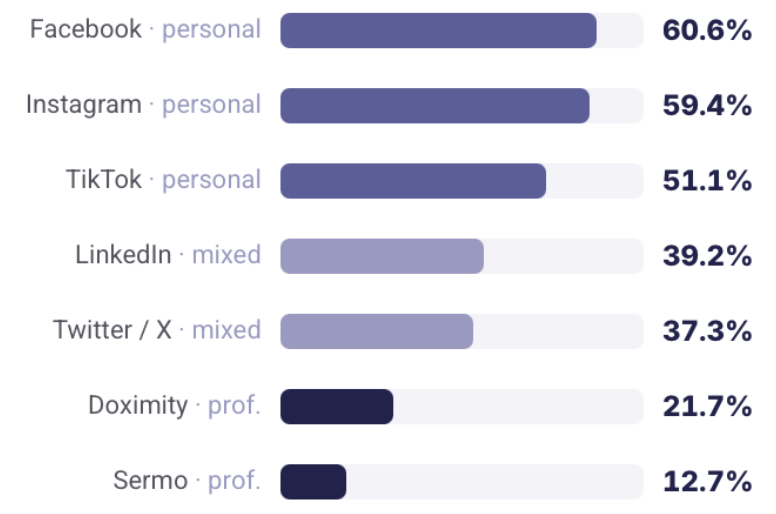
Reachable almost everywhere
HCPs reachable by format · ~3.4M HCPs
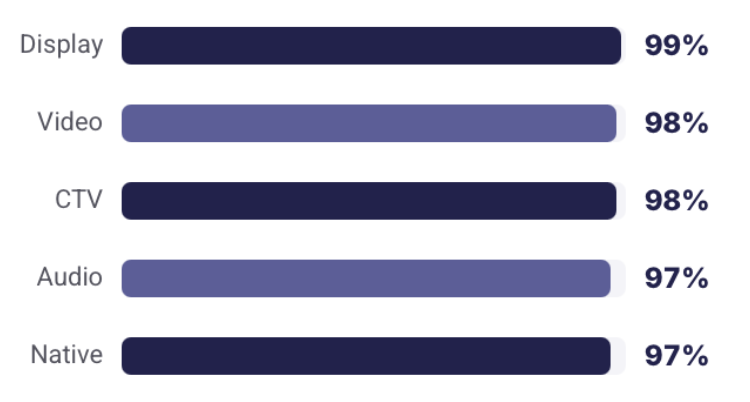
Reach isn't the problem anymore. What separates you now is identity, mix, and measurement.
THE PLAY
Physicians live in both worlds. Meet them where they scroll personally and where they engage professionally.
FINDING 7
Do digital ads to clinicians actually land?
WHAT THEY SAY
93% say they are receptive to clinician ads and 69% have noticed them.
WHAT THEY DO
DeepIntent's measurement shows HCPs reached on three or more channels have 9x higher TRx (Total Prescription) rates than single-channel exposures.
CTR is a limited measure of true campaign impact. Multi-channel presence, not clicks, is what moves scripts.
Stated receptivity is broad, but soft
% of physicians, survey
Multi-channel presence moves scripts
Relative Rx rate by number of channels a physician was reached on
THE PLAY
One ad won't do it. Physicians warm up to digital, but it's the repeat appearances across channels that actually move the needle.
FINDING 8 · FLAGSHIP
How do physicians really use AI?
WHAT THEY SAY
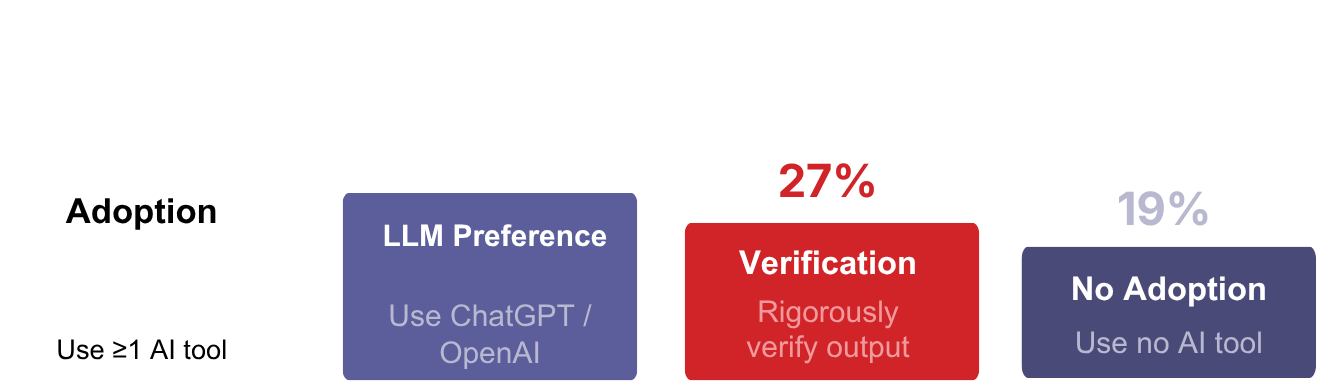
Most physicians now use AI for clinical information, reporting broad adoption across tools, led by ChatGPT.
WHAT THEY DO
DeepIntent's measurement shows AI assistants referred physicians to brand sites in 79% of campaigns, with ChatGPT holding the lion's share at 97%. Measured volume is still a fraction of a percent of total HCP visits.
That is almost certainly a floor. Most AI tools strip the referrer, so the visit registers as direct. Even so, AI-driven traffic is up ~81%+ year over year.
Adoption is racing ahead of verification
AI is already sending physicians to brand sites

THE PLAY
The question is no longer whether your message reaches AI, but how AI represents it. Structure content with clear claims, citations, and clean formatting so AI quotes it accurately.

THE GAP MAP
Every claim, plotted
We sorted all eight findings by the size of the gap between what physicians say and what they actually do: from the widest divergences down to the places where claim and behavior line up.
Wide Gap • 4 findings
How often do they want to hear from you?
When are they actually paying attention?
What content actually earns engagement?
How do physicians really use AI?
Medium Gap • 2 findings
Where do they actually go for information?
Do digital ads to clinicians land?
There is Alignment • 2 findings
Do physicians read what you send?
Which platforms actually reach them?
THE FRAME
What physicians say is a loud claim, not a proven behavior. The gap between the two is exactly where this report does its work.ABOUT THESE NUMBERS
Methodology & limits
The survey
896 qualified physicians across 25 questions
Self-reported attitudes and preferences: how often physicians want contact, which content they value, where they say they go, and how they describe using AI.
Read as stated intent
Survey answers capture aspiration and recall, not action. We pair every stated claim with a behavioral read rather than taking it at face value.
The behavior
2.4M
HLD email opens (timing finding)
221
content-categorized campaigns · ~2.4M opens
First-party engagement
Read-rate and content findings come from HLD's own 2026 program, corrected for a 15-minute send-time recording offset. Day and hour reflect our send cadence as much as preference.Partner data · DeepIntent
Destination, reach, and AI-referral findings come from DeepIntent's verified-clinician measurement, a different panel and method. DeepIntent HCP behavior analysis study n = 3.4M HCPs.ABOUT
HealthLink Dimensions
HealthLink Dimensions helps healthcare marketers reach and engage clinicians with accuracy and respect. Our verified provider data and engagement solutions span the physician audience across email and programmatic channels, built on a privacy-compliant foundation.
This report pairs survey research with our own first-party engagement signal so marketers can plan against what physicians actually do, not only what they say. The behavioral read reinforces the survey rather than competing with it.
Data To Insight. One Trusted Partner.
ABOUT
DeepIntent
DeepIntent was founded on a simple but powerful belief: healthcare advertising can and should drive better patient outcomes. By uniting media, identity, and real-world clinical data, our platform empowers the world’s leading healthcare brands and agencies to deliver privacy-safe, omnichannel campaigns with measurable impact.
Guided by innovation, integrity, and impact, we combine data science, media expertise, and healthcare knowledge to solve one of the industry’s toughest challenges: how to connect patients and providers through meaningful, privacy-safe advertising.